Features Rahasia Belajar Candlestick
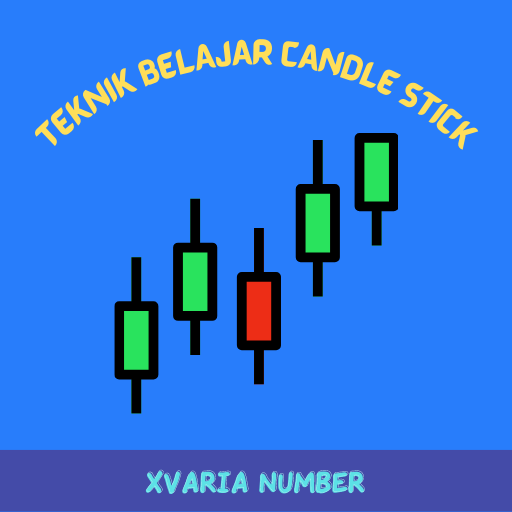
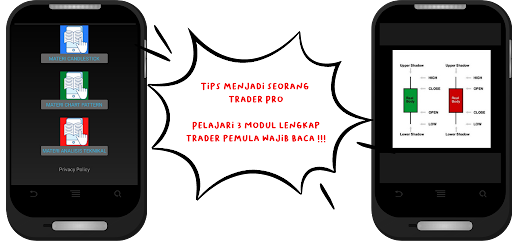
A candlestick is a type of stock price chart used in technical analysis that shows the highest, lowest, open and close price of a stock over a certain period of time.Candlesticks which are currently used as technical analysis in the stock market have two main components that you need to know, friends, namely:· Candle Body (Body): part of the candlestick that shows the opening price and closing price at a certain point in time which is shown from a red or green rectangle shape; or black or white.· Candle tail (Shadow/Wick): the part that shows the highest price and lowest price of the stock at a certain point in time indicated by a straight line that stretches above and below the body of the candlestick and is the same color as the shape of the candle (candle).Apart from the main components in the candlestick, there are two colors used in the candlestick, namely red and green.
Red means that there is a decrease in the stock price (bearish) which means the closing price is lower than the opening price.
Meanwhile, green means an increase in stock prices (bullish) which means the closing price is higher than the opening price.
However, in some cases, friend, if the displayed candlestick is colorless, black is used to indicate a bearish situation, while white is used to indicate a bullish situation.- There are several modules that you can read about pattern forms in Candlesticks.- Understand what a Chart Pattern is- Also Understand how to use technical analysis.Hopefully Helpful for all of you
Gaming Features
Enjoy immersive gaming experience with various game modes.
Financial Tools
Manage your finances and track your expenses easily.
24/7 Support
Our dedicated support team is always ready to help you.
See the Rahasia Belajar Candlestick in Action

Get the App Today
Available for Android 8.0 and above